Market Insights Daily

Explore trading strategies, mutual funds, and investment risks in Indian and global markets with expert advice.

Nifty Analysis for 27 DEC 2024

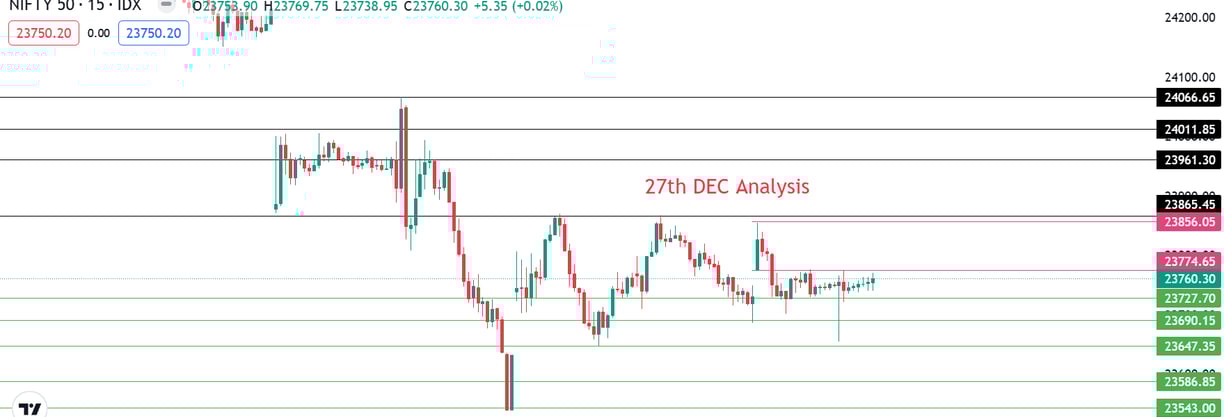
Price is closed at 23750 below that 23690-23647 may act as immediate support. Price below 23647 may take nifty to 23630 and further breaking may lead to words 23580-23543 Price above 23856-23870 may lead Nifty towards 23961-24011 further, if the price sustains above 24066 nifty may take a sharp move towards 24199 to fill the gap.

Nifty Bank Analysis for 27 DEC 2024

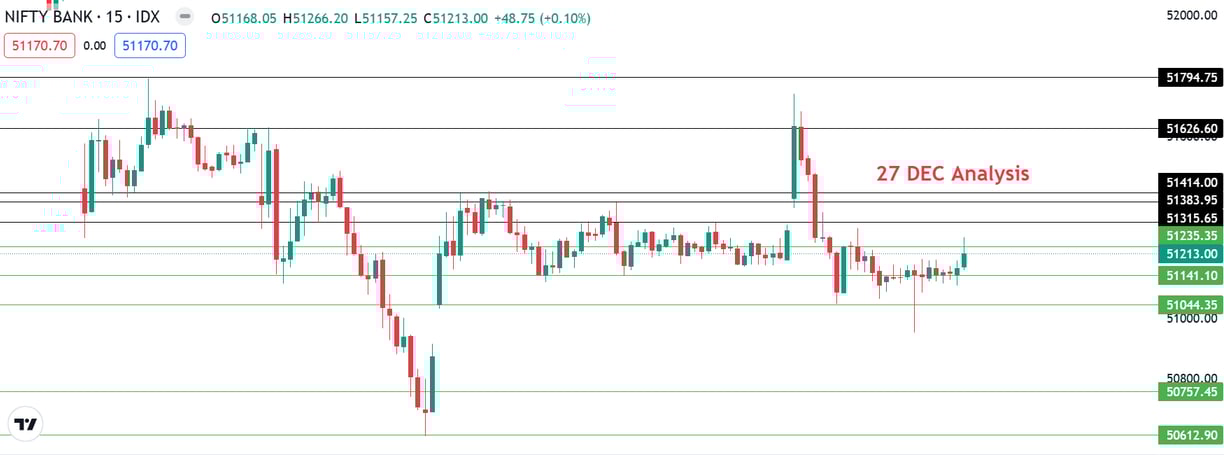
Price is closed at 51170 which may act as support below which immediate support is at 51141 below that next support at 51050-50950, if it breaches we may see price heading towards 50850-50756 followed by 50612. Price above 51233 it may reach 51315 followed by 51383-51414 above that 51573-51626 and if the uptrend continues 51794-52000 is next final target.

Nifty Analysis for 26 DEC 2024

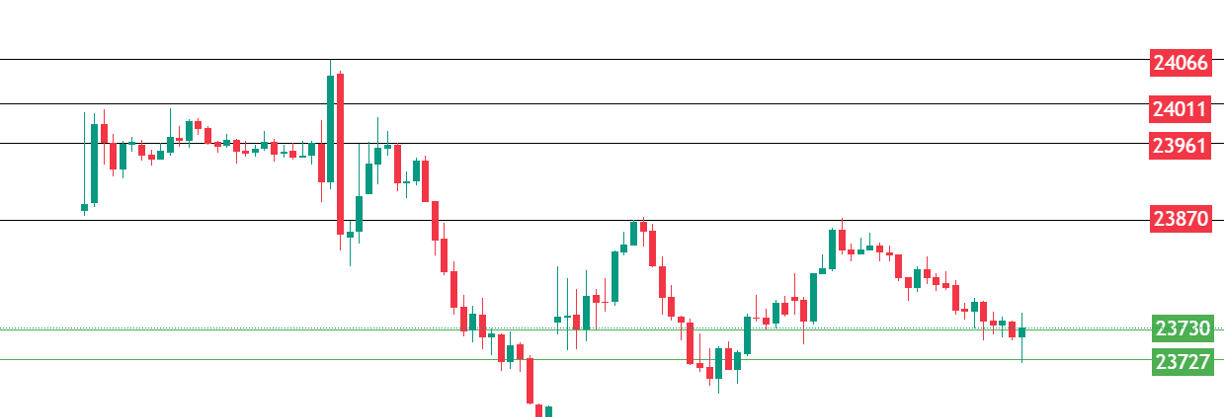
Price is closed at 23727 below that 23647-23690 may act as immediate support. Price below 23647 may take nifty to 23630 and further breaking may lead to words 23580 followed by 23543 Price above 23870 make lead Nifty towards 23961-24011 further, if the price sustains above 24066 nifty make take a sharp move towards 24199.

Nifty Bank Analysis for 26 DEC 2024

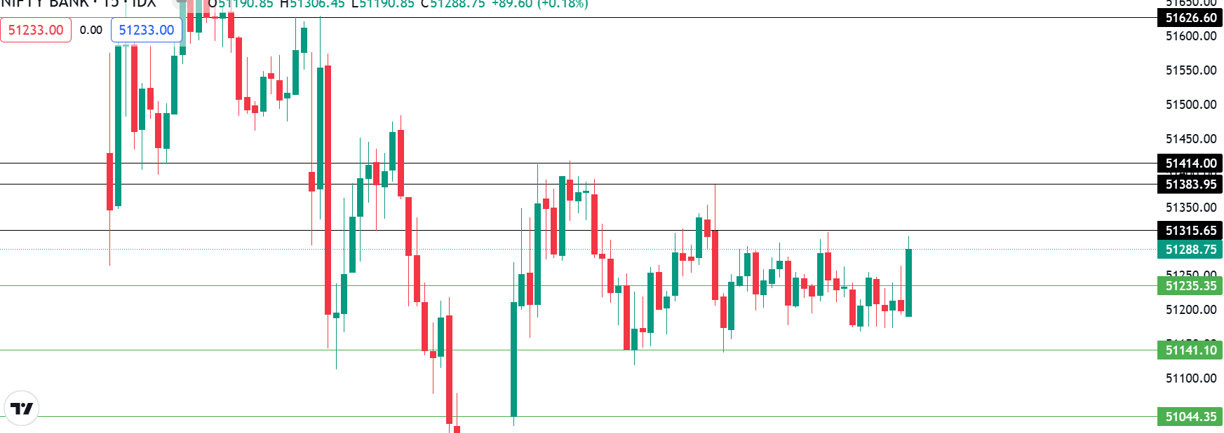
Price is closed at 51233 which may act as support below which immediate support is at 51141 below that next support at 51050-51000, it it breaches we may see price heading towards 50750 followed by 50612. Price above 51233 it may reach 51315 followed by 51383-51414 above that 51573-51626 and if the uptrend continues 51794-52000 is next final target.

Market Insights

Daily views on stock markets, trading strategies, and mutual fund advice.

A digital financial chart with green and red zigzag lines on a dark background, representing market trends. Below the main graph, there are smaller charts featuring bar indicators in red and blue, along with a yellow line graph.
Hands typing on a laptop keyboard with a screen displaying financial graphs and stock market data. Multiple charts and numbers are visible, indicating online trading or financial analysis.
A hand holds a smartphone displaying a financial chart with candlestick patterns. In the background, a large, similar financial graph is visible on a screen, featuring fluctuating lines and data points.
A hand holding a smartphone displaying a stock trading chart with details on stock prices. The phone is above a wooden table where a blurred laptop screen in the background shows similar financial data. Natural light comes in from the window, creating a relaxed working environment.
A hand holding a smartphone displaying a colorful line graph with various candlestick patterns, indicative of financial or stock market data. The background consists of a textured, woven fabric surface in neutral tones.
A hand is holding a smartphone that displays a stock market chart with various candlestick patterns and horizontal lines. The phone is held against a textured fabric background, which appears to be a sofa or carpet.