
Nifty and Bank Nifty Level
Explore Daily Nifty and Bank Nifty Level for Option trading, Market Strength and Future Trading
Nifty Analysis for 31st DEC 2024
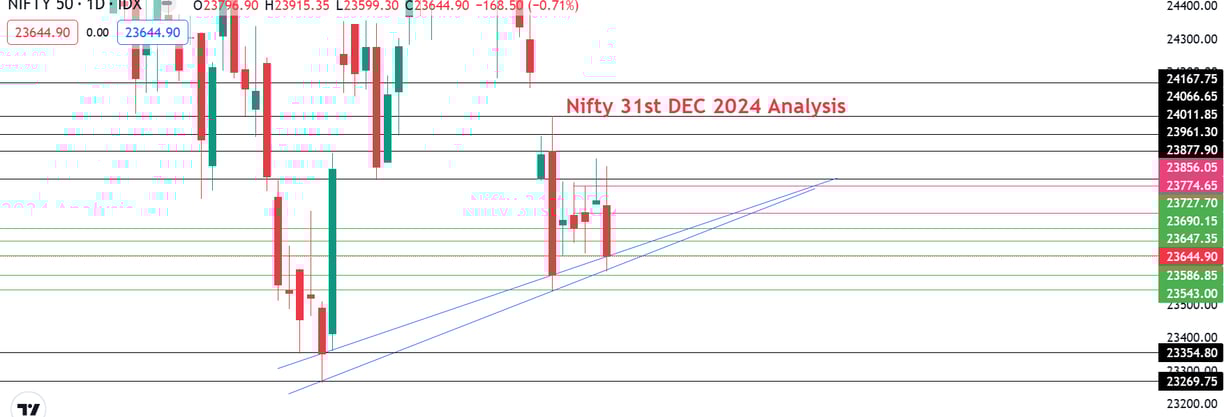
Price is closed at 23644 below that 23586-23543 may act as strong support. Price below 23543 may take nifty to 23354 and further breaking may lead towards 23269. Price above 23877 may lead Nifty towards 23900-24961 further, if the price sustains above 24011 nifty may take a sharp move towards 24066-24167 to fill the gap. Nifty is respecting the Blue trend line , respecting this may form a base/support. Green colour indicates support points and Red Colour indicates Resistance points. Price holding at Support points give buy signal and Price holding at Resistance give sell signal.
Nifty Bank Analysis for 31st DEC 2024
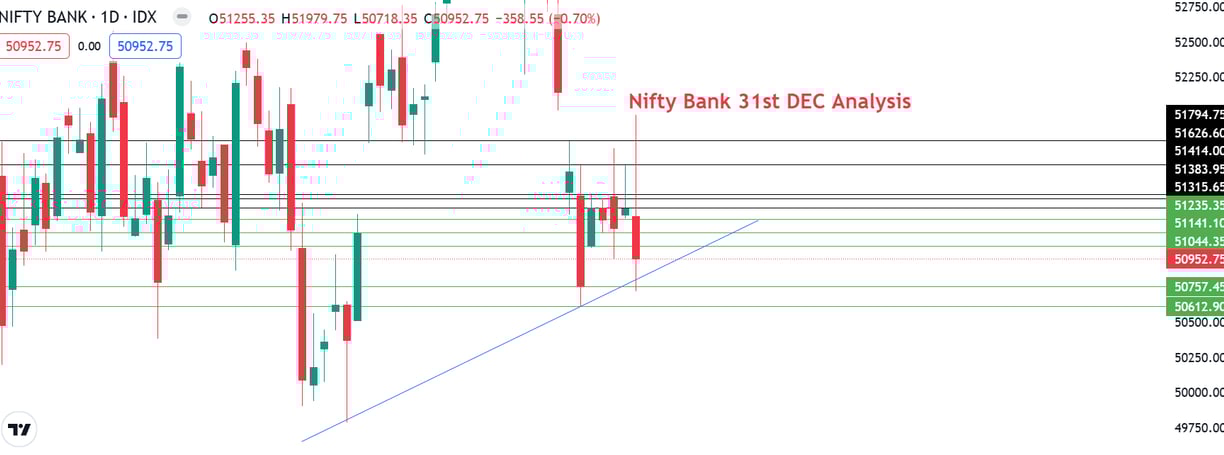
Price is closed at 50952 below that 50757-50612 may act as strong support. Price below 50500 may take Nifty Bank to 50300 and further breaking may lead towards 50050-49800. Price above 51250 may lead Nifty Bank towards 51315-51415 further, if the price sustains above 51626 Nifty Bank may take a move towards 51794. Nifty bank is respecting the Blue trend line , respecting this may form a base/support. Green colour indicates support points and Red Colour indicates Resistance points. Price holding at Support points give buy signal and Price holding at Resistance give sell signal.
Nifty Analysis for 30 DEC 2024
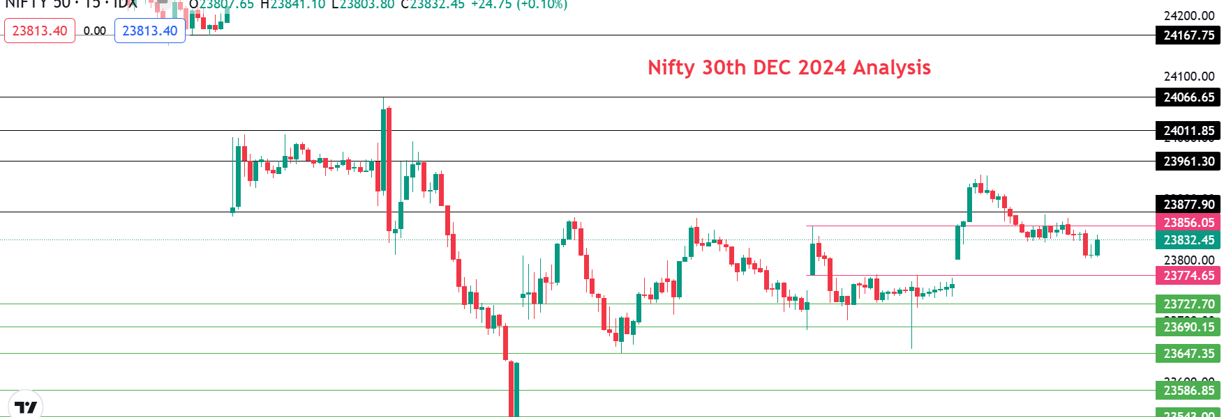
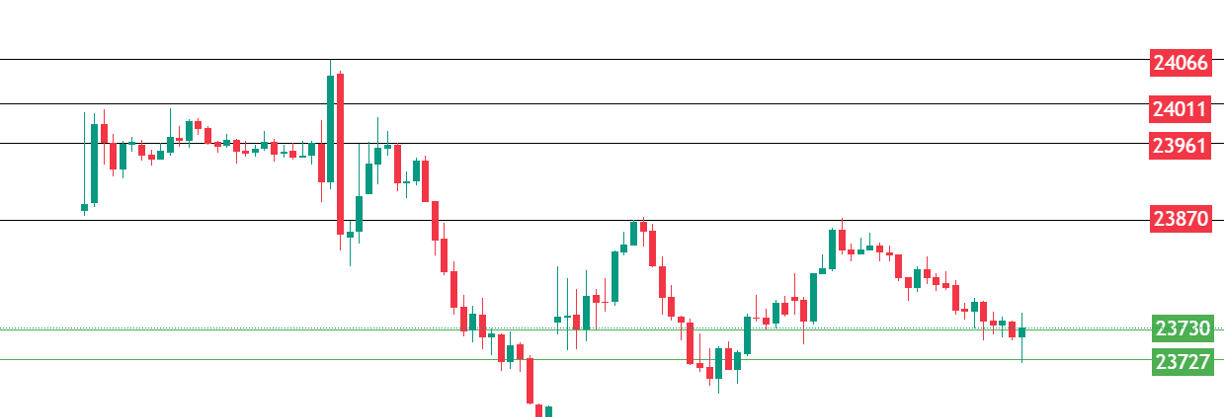
Price is closed at 23813 below that 23800-23774 may act as immediate support. Price below 23774 may take nifty to 23727 and further breaking may lead to words 23690-23647. Price above 23877 may lead Nifty towards 23961-24011 further, if the price sustains above 24011 nifty may take a sharp move towards 24066-24167 to fill the gap.
Nifty Bank Analysis for 30 DEC 2024
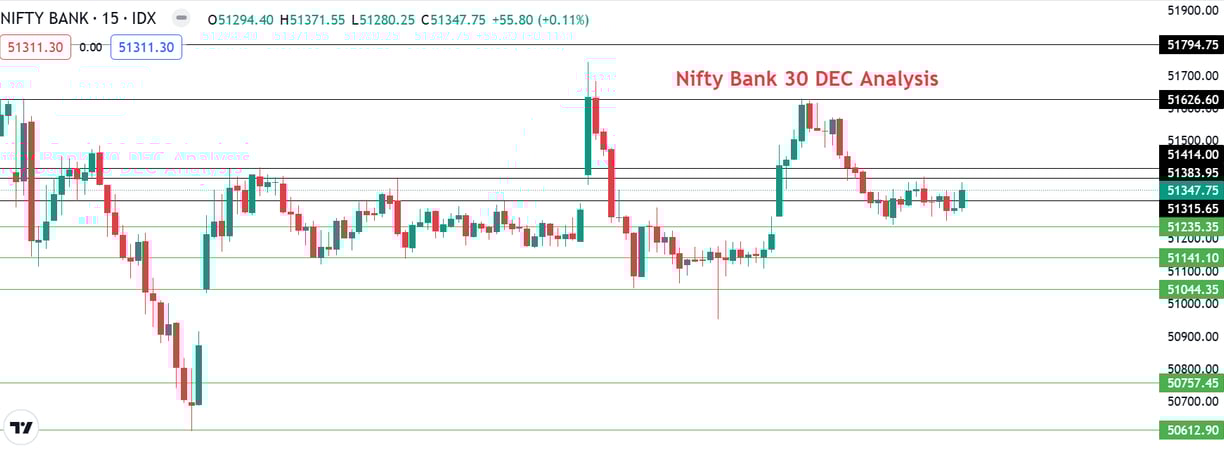
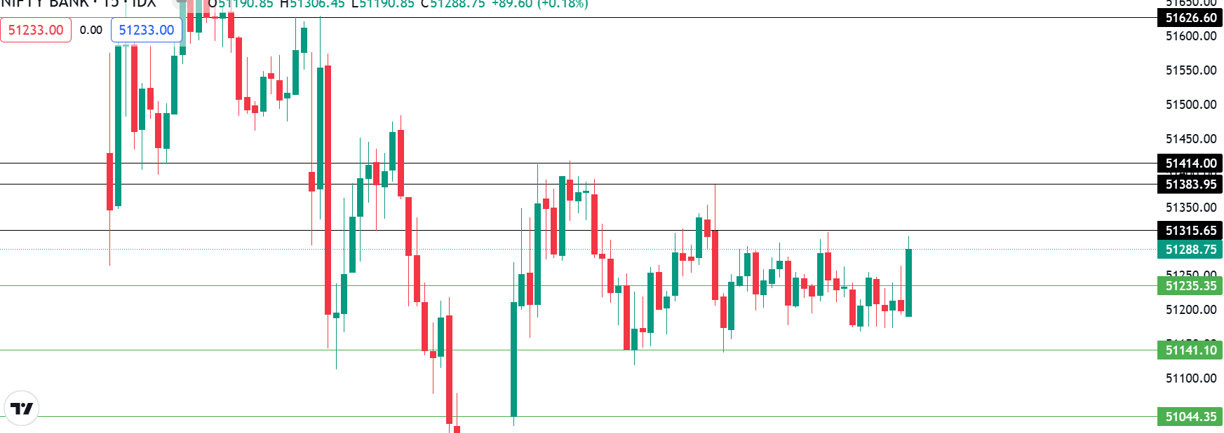
Price is closed at 51311 which may act as support below which immediate support is at 51235 below that next support at 51141-51044, if it breaches we may see price heading towards 50900-50756 followed by 50612. Price above 51414 it may reach 51626 followed by 51794 above that 52029 and if the uptrend continues 52229 is next final target.
Nifty Analysis for 27 DEC 2024
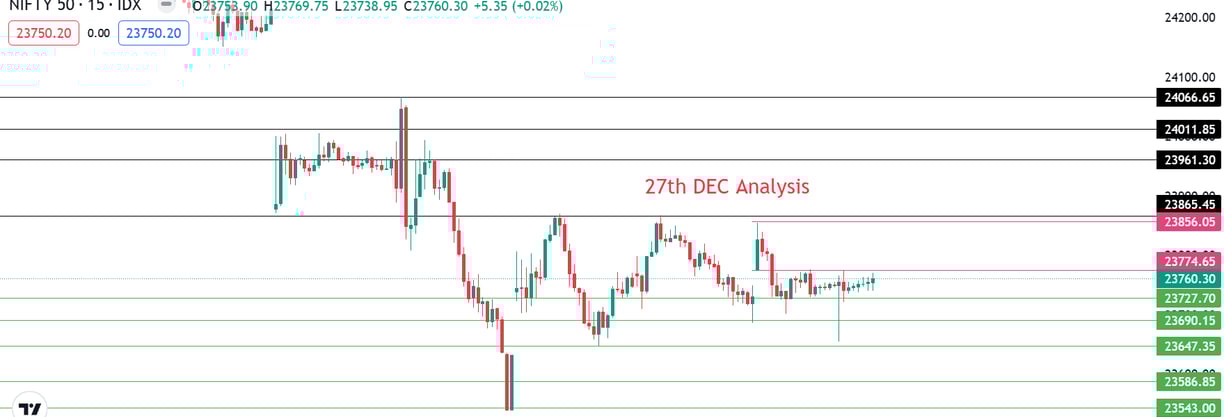
Price is closed at 23750 below that 23690-23647 may act as immediate support. Price below 23647 may take nifty to 23630 and further breaking may lead to words 23580-23543 Price above. 23856-23870 may lead Nifty towards 23961-24011 further, if the price sustains above 24066 nifty may take a sharp move towards 24199 to fill the gap.
Nifty Bank Analysis for 27 DEC 2024
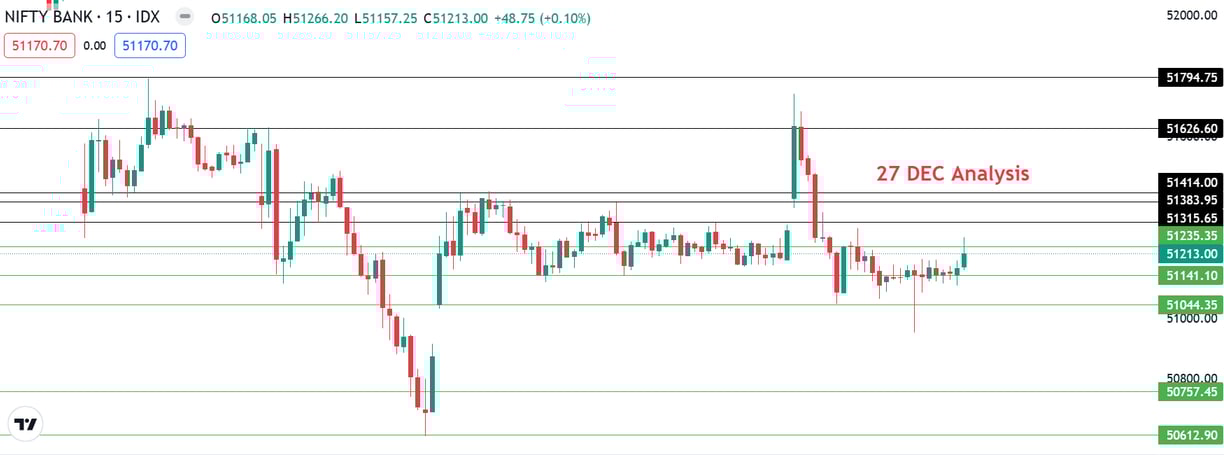
Price is closed at 51170 which may act as support below which immediate support is at 51141 below that next support at 51050-50950, if it breaches we may see price heading towards 50850-50756 followed by 50612. Price above 51233 it may reach 51315 followed by 51383-51414 above that 51573-51626 and if the uptrend continues 51794-52000 is next final target.
Nifty Analysis for 26 DEC 2024
Price is closed at 23727 below that 23647-23690 may act as immediate support. Price below 23647 may take nifty to 23630 and further breaking may lead to words 23580 followed by 23543 Price above 23870 make lead Nifty towards 23961-24011 further, if the price sustains above 24066 nifty make take a sharp move towards 24199.
Nifty Bank Analysis for 26 DEC 2024
Price is closed at 51233 which may act as support below which immediate support is at 51141 below that next support at 51050-51000, it it breaches we may see price heading towards 50750 followed by 50612. Price above 51233 it may reach 51315 followed by 51383-51414 above that 51573-51626 and if the uptrend continues 51794-52000 is next final target.
Market Insights
Daily views on stock markets, trading strategies, and mutual fund advice.


